Sample Plots
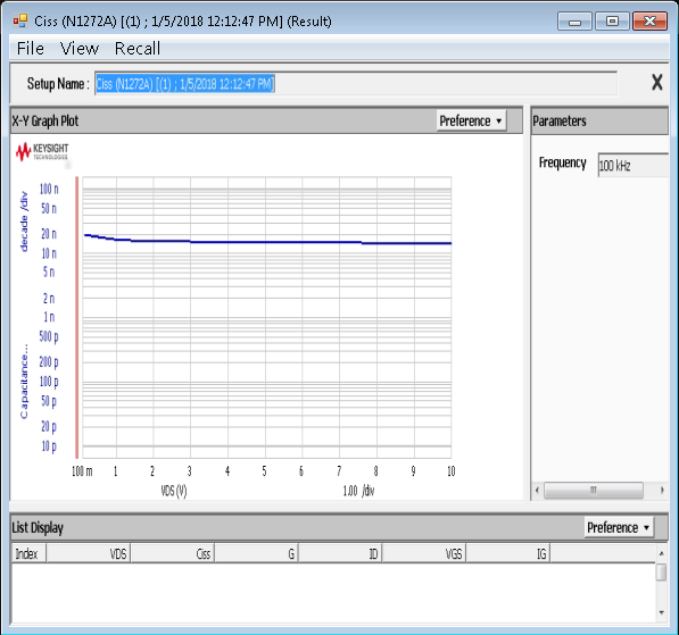
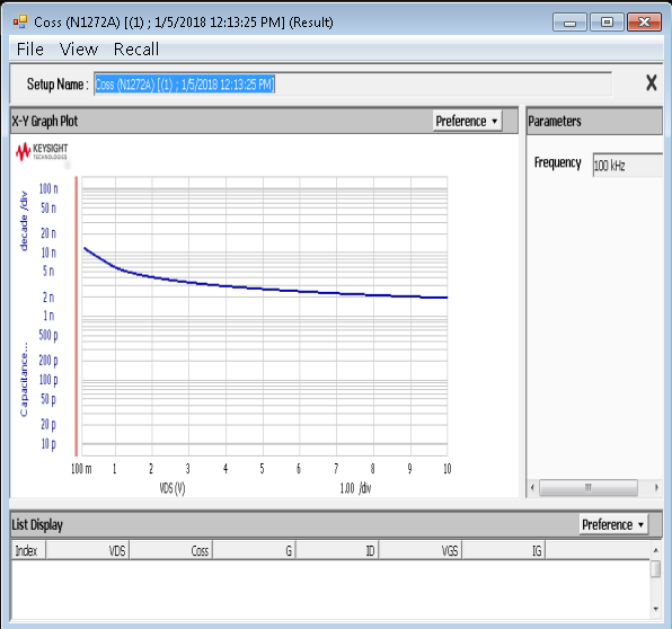
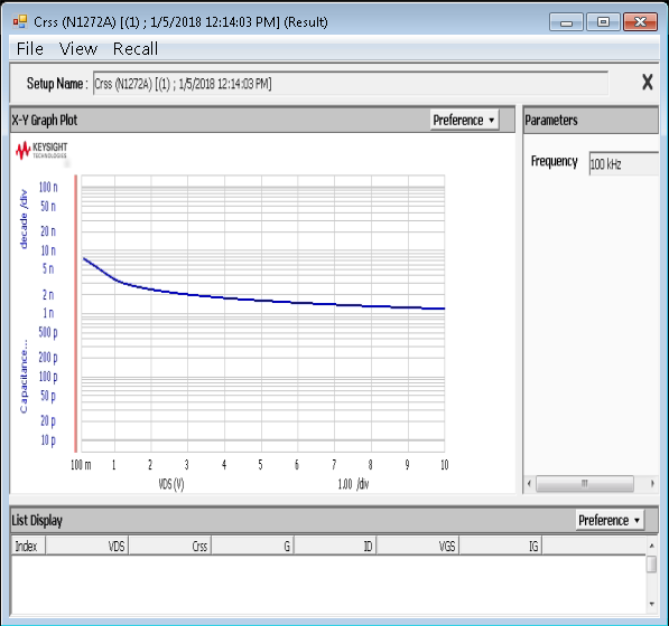
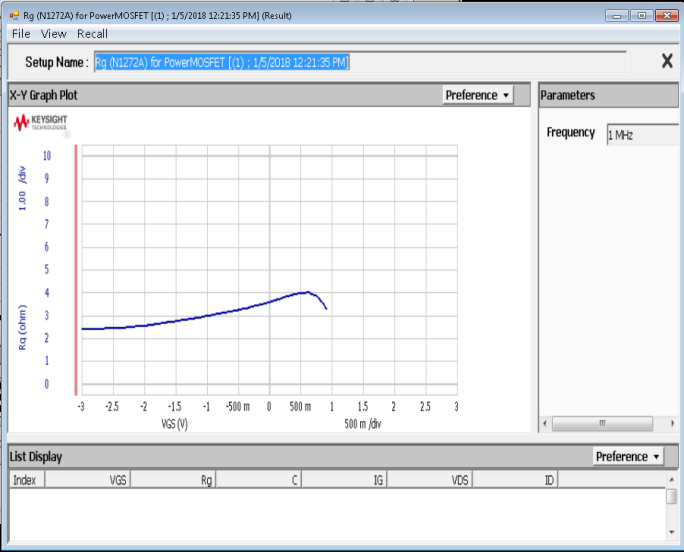
The following examples show plots for capacitance vs. voltage and gate resistance for a power FET device.
IV and CV device characterization plots appear on the B1506A or B1505A network analyzer screen, not on the host PC PD1000A display. The device characterization data is stored on the host PC in the location specified in the Settings menu.
For more information, see:
-
Configure Common Settings on IV and CV Characterization Tests.
Ciss Plot:
Coss Plot:
Crss Plot:
Rg Plot:


